The European Commission JRC recently released a new 2023 update of the Global Human Settlement Layer (GHSL) data. This update has greatly improved the GHSL data, with a 10 metre scale built-up area dataset of the entire globe which has been used to create a 100 metre scale global population density layer. The level of detail for cities and rural areas is impressive, and it overcomes the limitations of previous releases of the GHSL. I have updated the World Population Density Map website to include this new 2023 data, with both the cartography and statistical analysis now based on the new data.
Improved Level of Detail for Cities and Rural Landscapes
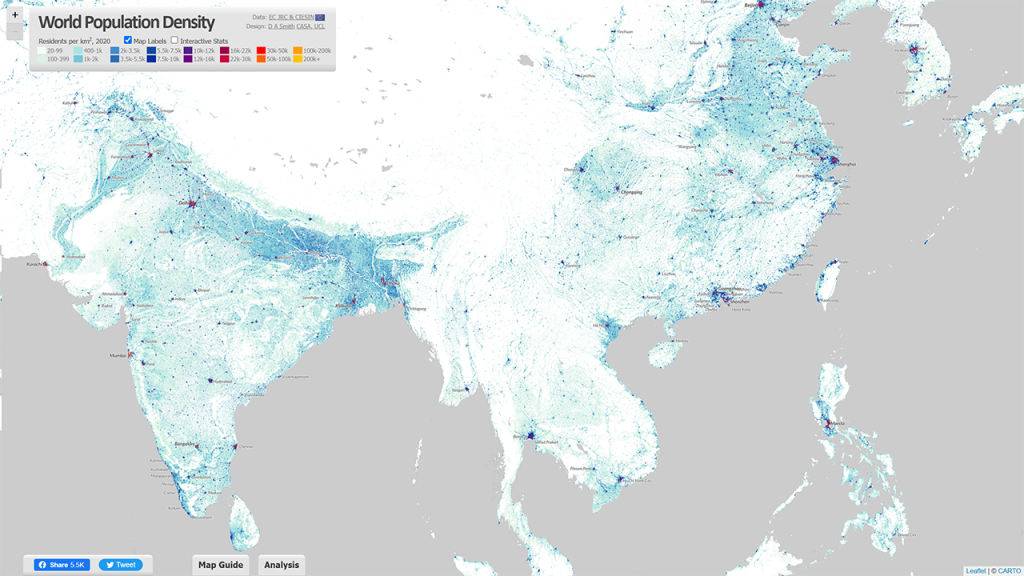
The new GHSL 2023 data has produced a much more detailed 10 metre dataset of built-up area (using recent European Space Agency Sentinel data), and this is the basis for creating the updated population layer. The results are much improved, particularly for complex rural and peri-urban landscapes in the Global South, such as for India shown below. The tens of thousands of small villages are identified and used to more accurately distribute India’s huge population. This is also the case for other key regions such as Sub-Saharan Africa, and China.

The added level of detail also improves the representation of cities, with more accurate density analysis, and improved techniques to differentiate residential from industrial and commercial urban land uses. Previous releases of the GHSL were underestimating urban densities for cities where census data was weaker, but this appears to no longer be the case. The dataset can now be used for more accurate comparisons of population and density for cities across the globe. Example images for Shanghai and New York City are shown below.


Country Density Profiles – the Diversity of Human Settlement
The statistical analysis on the World Population Density Map website has also been updated using the 2023 GHSL data, so you can view the density profiles for all countries around the globe. Some highlights are shown below.


To complement the graph of the population in each density category, this updated version of the World Population Density Map includes Population Weighted Density statistics for each country and city. Population Weighted Density is a measure of the typical density experienced by residents in the country/city, in this case using the 1km2 scale GHSL data. The PWD is calculated by weighting each 1km2 cell according to the population, summing all the cells for the city/region, and then dividing the sum by the total population of the country/city (i.e. the arithmetic mean). This is a more representative measure than standard population density, which is affected by low density suburban/peri-urban and rural land, even where the population in these areas is relatively low.
China and India have very high density cities, but their large rural populations translate into moderate Population Weighted Density statistics overall. India is 9.9k pp/km2 and China is 8.9k pp/km2. The table below shows the top 20 countries by Population Weighted Density using the 2020 data-
| Rank (by PWD 2020) | Country Name | Population Weighted Density 2020 (pp/km2) |
|---|---|---|
| 1 | Singapore | 30.9k |
| 2 | Republic of Congo | 25.2k |
| 3 | Somalia | 24.1k |
| 4 | Egypt | 21.8k |
| 5 | Comoros | 17.4k |
| 6 | Djibouti | 17.2k |
| 7 | Iran | 16.8k |
| 8 | Yemen | 16.7k |
| 9 | Jordan | 15.8k |
| 10 | North Korea | 14.8k |
| 11 | Democratic Republic of the Congo | 14.2k |
| 12 | Bahrain | 13.9k |
| 13 | Colombia | 13.5k |
| 14 | Equatorial Guinea | 13.5k |
| 15 | Turkey | 13.5k |
| 16 | Morocco | 13.4k |
| 17 | Bangladesh | 13.3k |
| 18 | Taiwan | 12.9k |
| 19 | South Korea | 12.7k |
| 20 | Western Sahara | 12.6k |
For comparison, the equivalent Population Weighted Density figure for the UK is 4.1k, France is 3.7k and Germany is considerably lower at 2.7k. The USA is renowned for its low density living and suburban sprawl, and the Population Weighted Density measure for 2020 is 2.2k. This is the lowest figure for any large developed country in the world. Smaller developed countries have similar figures to the USA, including New Zealand, Norway and the Republic of Ireland.
Analysing the World’s Largest City-Regions Using the GHSL
The Built-Up Area and Population layers in the GHSL are used to define a settlement model (GHSL-SMOD) layer, which classifies land into urban and rural typologies. We can use this layer to define the boundaries of city-regions across the globe. This has been done using continuous areas of the highest urban category (urban centres) for the 2020 data. When you hover over cities on the World Population Density website, these city boundaries are highlighted-

This land use based method of defining city-regions produces different estimates of city populations to analyses based on administrative boundaries. The GHSL method generally emphasises large continuous urban regions, such as the megacity region of the ‘Greater Bay Area’ in China shown above, which has formed from the fusion of Guangzhou, Shenzhen, Dongguan and Jiangmen. This is the largest city-region in the world by this measure, with a population of 43.8m in 2020 (rapidly developing from a base of 5.8m in 1980). The top twenty city-regions in the world are shown below-
| Rank (by Pop. 2020) | City-Region Name | Population 1980 | Population 2000 | Population 2020 | Pop. Weighted Density 2020 (pp/km2) |
|---|---|---|---|---|---|
| 1 | Guangzhou-Shenzhen-Dongguan-Jiangmen | 5.8m | 30.9m | 43.8m | 20k |
| 2 | Jakarta | 16.1m | 26.3m | 38.7m | 13.4k |
| 3 | Tokyo | 27m | 31.3m | 34.1m | 10.2k |
| 4 | Delhi | 8.3m | 19.1m | 30.3m | 29k |
| 5 | Shanghai | 6.7m | 15.1m | 27.8m | 27.9k |
| 6 | Dhaka | 6.2m | 14.8m | 26.8m | 47.9k |
| 7 | Kolkata | 16.3m | 22.9m | 26.7m | 36.4k |
| 8 | Manila | 11.3m | 18.3m | 24.8m | 27.1k |
| 9 | Cairo | 9.8m | 16.6m | 24.5m | 44.9k |
| 10 | Mumbai | 11.3m | 18.4m | 22.9m | 52.4k |
| 11 | Seoul | 13.3m | 19.7m | 22.7m | 19.8k |
| 12 | São Paulo | 13.7m | 17.4m | 19.7m | 14.5k |
| 13 | Beijing | 7.2m | 11.6m | 19m | 20.2k |
| 14 | Karachi | 5.8m | 10.9m | 18.7m | 48.8k |
| 15 | Mexico City | 13.8m | 17.9m | 17.8m | 13.2k |
| 16 | Bangkok | 5.4m | 9.2m | 17.4m | 11.6k |
| 17 | Osaka | 17.2m | 16.8m | 15.6m | 8.1k |
| 18 | Moscow | 9.9m | 11.9m | 14.9m | 16.7k |
| 19 | Los Angeles | 10m | 13.1m | 14.5m | 4.6k |
| 20 | Istanbul | 6.1m | 10.4m | 14.3m | 25.2k |
One of the most impressive aspects of the GHSL is that it is a timeseries dataset going back to 1975. Therefore we can create historical indicators such as the population change data shown in the table above. Many cities have more than doubled, or even tripled in population size since 1980, including Delhi, Shanghai, Dhaka and Karachi. Rates of growth in the USA, Japan and Europe are inevitably much lower, as seen in Tokyo and Los Angeles in the table above. Tokyo is often measured as the world’s largest city (for example in the UN World Urbanization Prospects), though with the GHSL method Tokyo the third largest at 34.1m in 2020. Tokyo is also distinctive in terms of its Population Weighted Density at 10.2k pp/km2. While this figure is more than double the density of Los Angeles, Tokyo’s medium density is much lower than cities in China and South Asia. Incredibly, Mumbai’s density figure is five times higher than Tokyo at 52.4k pp/km2, and Karachi is not far behind at 48.8k.


Credits and Links
The Global Human Settlement Layer is published by the European Commission Joint Research Centre. All the GHSL layers are available as open data and can be downloaded on their website. The GHSL population data uses as an input the Gridded Population of the World data by CIESEN at Columbia University.
The World Population Density Map website has been created by Duncan A. Smith at CASA UCL. The mapping data is hosted on a tileserver at CASA UCL kindly set up by Steven Gray. The interactive mapping layers are hosted on Carto.


